---title: "Tidy Modeling with R part 1"author: "Tony Duan"date: "2023-06-01"categories: [Modeling]execute: warning: false error: falseformat: html: code-fold: show code-tools: trueimage: "cover.png"---https://www.tmwr.org/## 1 Software for modeling### 1.1 FUNDAMENTALS FOR MODELING SOFTWARE### 1.2 TYPES OF MODELSDESCRIPTIVE MODELSINFERENTIAL MODELSPREDICTIVE MODELS### 1.3 CONNECTIONS BETWEEN TYPES OF MODELS### 1.4 SOME TERMINOLOGY### 1.5 HOW DOES MODELING FIT INTO THE DATA ANALYSIS PROCESS?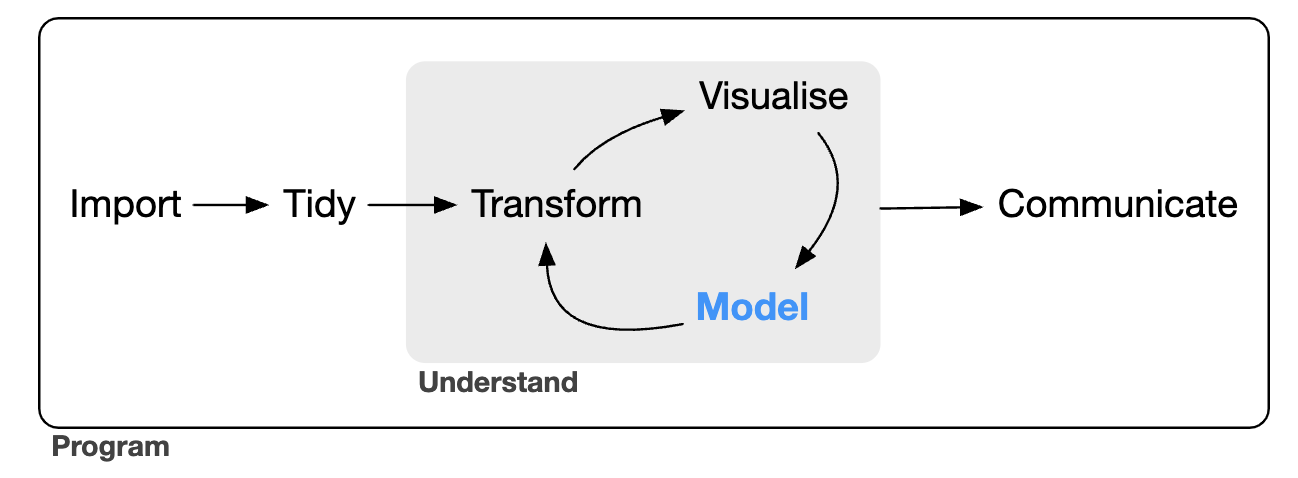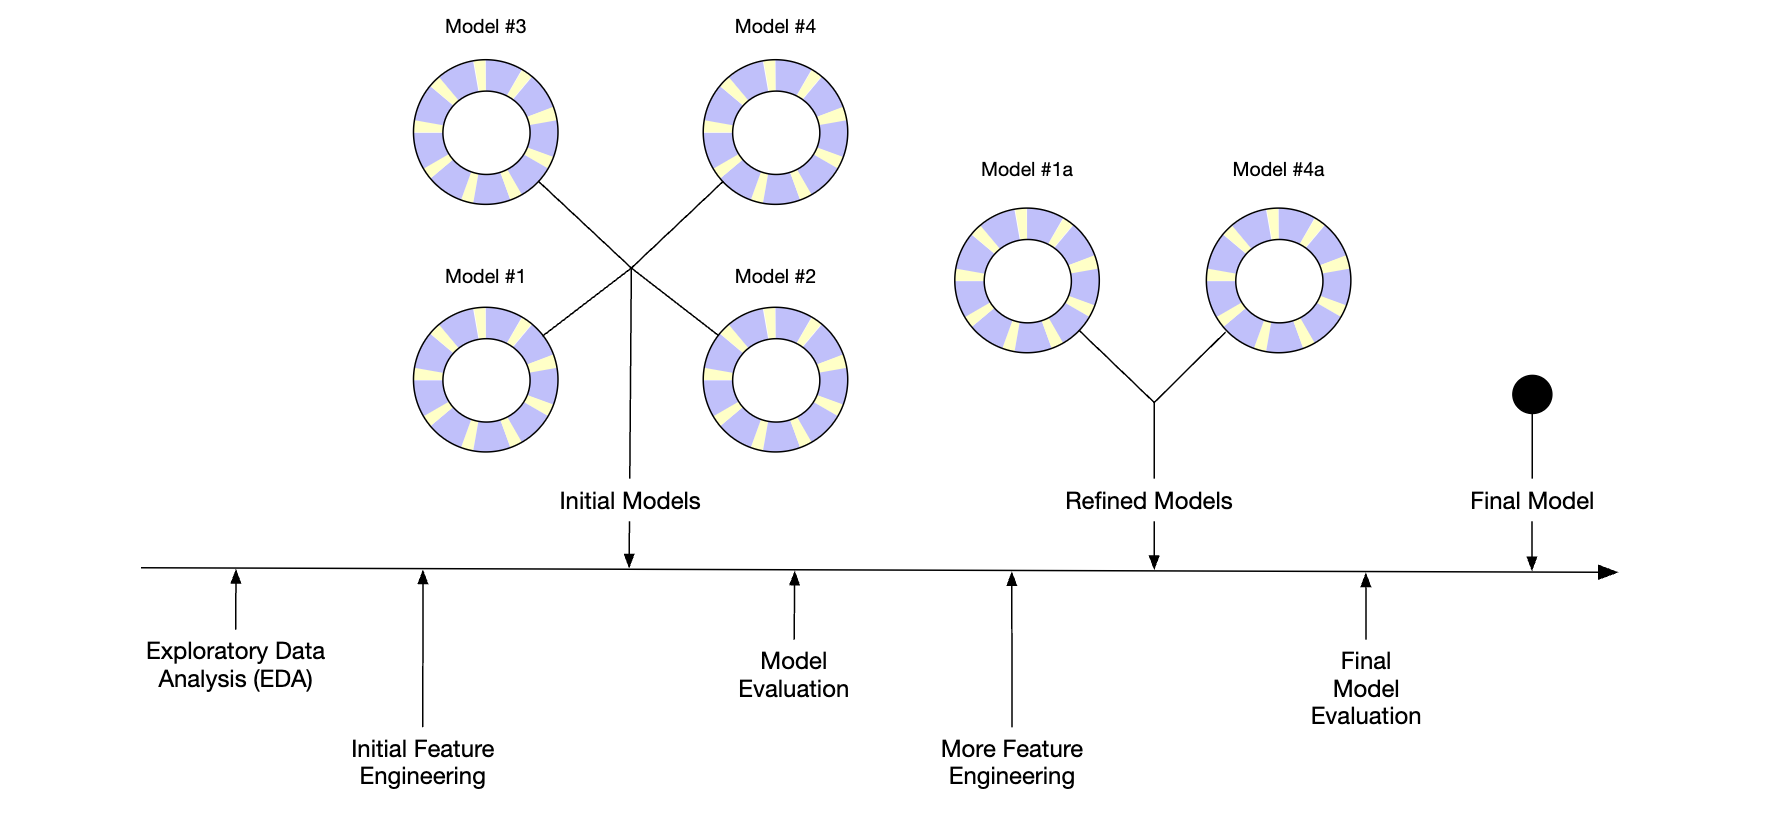## 2 A Tidyverse Primer### 2.1 TIDYVERSE PRINCIPLES### 2.2 EXAMPLES OF TIDYVERSE SYNTAX## 3 A Review of R Modeling Fundamentals### 3.1 AN EXAMPLE```{r}library(tidyverse)data(crickets, package ="modeldata")names(crickets)# Plot the temperature on the x-axis, the chirp rate on the y-axis. The plot# elements will be colored differently for each species:ggplot(crickets, aes(x = temp, y = rate, color = species, pch = species, lty = species)) +# Plot points for each data point and color by speciesgeom_point(size =2) +# Show a simple linear model fit created separately for each species:geom_smooth(method = lm, se =FALSE, alpha =0.5) +scale_color_brewer(palette ="Paired") +labs(x ="Temperature (C)", y ="Chirp Rate (per minute)")```## 4 The Ames Housing Data```{r}library(modeldata) # This is also loaded by the tidymodels packagedata(ames)# or, in one line:data(ames, package ="modeldata")dim(ames)``````{r}library(tidymodels)tidymodels_prefer()ggplot(ames, aes(x = Sale_Price)) +geom_histogram(bins =50, col="white")``````{r}ggplot(ames, aes(x = Sale_Price)) +geom_histogram(bins =50, col="white") +scale_x_log10()``````{r}ames <- ames %>%mutate(Sale_Price =log10(Sale_Price))``````{r}library(tidymodels)data(ames)ames <- ames %>%mutate(Sale_Price =log10(Sale_Price))```## Referencehttps://www.tmwr.org/

